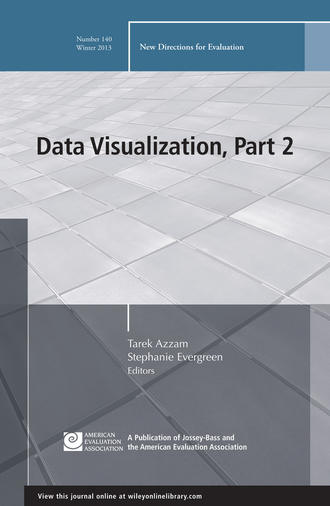
Data Visualization, Part 2. New Directions for Evaluation, Number 140
3.4 из 5, отдано 15 голосов

Evergreen Stephanie
This issue delivers concrete suggestions for optimally using data visualization in evaluation, as well as suggestions for best practices in data visualization design. It focuses on specific quantitative and qualitative data visualization approaches that include data dashboards, graphic recording, and geographic information systems (GIS). Readers will get a step-by-step process for designing an effective data dashboard system for programs and organizations, and various suggestions to improve their utility. The next section illustrates the role that graphic recording can play in helping programs and evaluators understand and communicate the mission and impact that an intervention is having in a democratic and culturally competent way. The GIS section provides specific examples of how mapped data can be used to understand program implementation and effectiveness, and the influence that the environment has on these outcomes. Discusses best practices that inform and shape our data visualization design choices Highlights the best use of each tool/approach Provides suggestions for effective practice Discuss the strengths and limitations of each approach in evaluation practice This is the 140th volume of the Jossey-Bass quarterly report series New Directions for Evaluation, an official publication of the American Evaluation Association.Категория: зарубежная образовательная литература
ISBN: 9781118833612
Правообладатель: John Wiley & Sons Limited
Легальная стоимость: 2654.06 руб.
Ограничение по возрасту: 0+


Комментарии ():